 Skip to content

Google Analytics has been long used for tracking and reporting website traffic. Still, it doesn’t unveil the data of the internal search box, where up to 50% of digital shoppers go straight to when they enter an eCommerce site. That’s why as a product filter and search developer, we build our own Analytics.
With this brand-new feature, you can do more than just track the searching and filtering behaviors.
→ In this article, we will:
- Look into the Analytics feature to discover its function and usage
- Learn how to make the most of this Analytics feature by combining it with other functionalities of Boost Product Filter & Search app.
↓↓↓ Scroll down and we'll show you how this feature can help you understand your in-store customers' search behaviors in order to optimize for a higher conversion rate!

Analytics feature assists you in understanding your target audience through their searching behavior
What is the Analytics feature of Boost?
Because site search data is such a gold mine to boost your conversion rate as searchers at a 1.8x higher rate than visitors without searching. However, consumer data via site search is usually forgotten.
→ Beginner in terms of site search navigation? We have a detailed guideline for you here.
Boost Analytics feature does not only record the queries but also analyzes shopper interaction with the filtering, giving merchants an upper hand with customer insights.
With other useful features such as Synonyms, Stop words, and Merchandising, Boost Analytics holds the potential to uncover valuable insights for your business.
What information is there in the Analytics feature?

Analytics is straightforward and easy to use with in-app instruction
- Total filter clicks: shows the number of clicks on your filter trees.
- Top filter option values: shows the top option values selected by your customers
- Top filter value combinations: shows a list of combinations of all option values selected
- Total sales generated by app: the total revenue generated by our app metrics. This number is the money your customers have spent on your stores using our app's filter and search system.
- Total searches: how many times your shoppers use the store search box to look for products
- Top search terms: a list of the search terms most entered by customers
- Top search terms with no result: a list of search terms most entered by customers, but no products available to return as search results
- Total filter clicks on search page: the number of clicks on the filter trees of the search result
- Top filter option value on the search page (based on the search term): a list of top option values selected by your customers

A lot of information can be collected from Collection Analytics and Search Analytics
In Settings tab, you have the option to turn on or off the Order revenue tracking feature. Enabling Order revenue tracking allows our app to view your store orders and report the sales generated by our app’s filters and search.
⭐ Rest assured that the granted View orders permission is read-only, so we don't store any of your information.
Also in this Settings board, you can enter IPs to be excluded from our Analytics report in the Ignore IPs section. Just type in IP addresses you wish to exclude then click Add. Please always remember to Save settings before you go.
How can Analytics help your Shopify store get a higher conversion rate?
Analytics feature gives you an insight of Customers' Searching Behaviors
As a behavioral tracking tool, Analytics offers an extensive understanding of your customers on their way of searching. From the common search queries to the most clicked filter options, every shoppers’ activity on your sites suggests a precious insight into their behavior.
These data should lead you to the conclusions about their preferences, likes, and dislikes, what triggers their interest or what makes them leave your site.
Based on the data from Analytics, you can provide a smoother shopping experience, enhancing virtual touch-points for your customers, and achieving the sales goal.
→ Learn to build the optimal Collection Page here.
You have a valuable report of Products and Campaign Performance
The Analytics feature of Boost also summarizes your merchandise and shows the results of ongoing promotion campaigns.
You can’t improve what you can’t measure. So we provide you with helpful insights into how effective all filters and search settings are performing in your store.
Among the key data provided in our Analytics feature, Total sales generated by app stat appears to be one of the highlight indicators of your in-store search performance. Track this number to see if there’s anything that needs fixing in your Product filters and search.
Besides, by examining the Top search terms, you get to know what products are matching the customers’ needs. Then, you can make a more precise inventory forecast so desirable items are never out of stock.
Following shoppers’ paths in the Collections Analytics can help you uncover hot-selling merchandise, which yields brilliant promotion ideas.
Collection Analytics and Search Analytics also reveal how your current campaign is running. If your currently promoted products don’t appear in the top searched or top filtered results, it is likely that the promotion doesn’t deliver outstanding performance.
You can use Analytics to forecast Future Sales
Boost Analytics records real-time data, so you can see the shift in search keywords daily. If shoppers are putting “swimsuit” as the top search term, it’s time to prepare for the summer promotion.
In time, you may even predict the changes. Because our Analytics stores data in up to 365 days, e-merchants can notice when their customers begin to search for specific items.
By that, they can go ahead of the trend or even discover niche needs. Understanding customers’ interests and analyzing behavioral data are crucial to gain first-mover advantage.
3 tips to make good use of Analytics and other features
Analytics with Merchandising: Promote high-margin Products
After discovering your shoppers’ top keywords, applying Merchandising is the next step to drive sales for items that match the searched phrases.
💡 Pro tip: How Top eCommerce Sites work with Merchandising and Product promotion with the foolproof Merchandising tactics for your site.

Get inspiration for product recommendations from Top search terms and Top filter option value on the search page (Source: Banana Republic)
Featuring products in high demand on the homepage is an excellent idea to catch new visitors’ attention. If a product is popular, chances are: it will also be welcomed by first-time browsers too.
For shoppers checking out your site, it’s like reading their minds when you show them their favorite items!
Analytics with Stop Words and Synonyms: Provide Well-matched Search Results
Besides Analytics and Merchandising, Stop Words and Synonyms are two updates on the new feature release this June. Stop Words can narrow down the search results to the most relevant by eliminating redundant phrases, such as “and”, “or”, etc.
→ Check out how to use Stop Words for your Shopify store here.

Then, use Synonyms to bridge the gap perfectly.
→ Check out this easy guide on how to use Synonyms
Analytics with Filter and Search Setting: Optimize the Filter Tree and Search Suggestion
With instant search suggestions, Top search terms are a fantastic source to discover suitable items for “Popular search”. 69% of shoppers expect to see trendy items when they enter an eCommerce site, so your customers will thank you for putting the trending products in the search widget.
→ We have a super-detailed guideline on how to build a top-notch site search to boost your conversion. Check it out here.
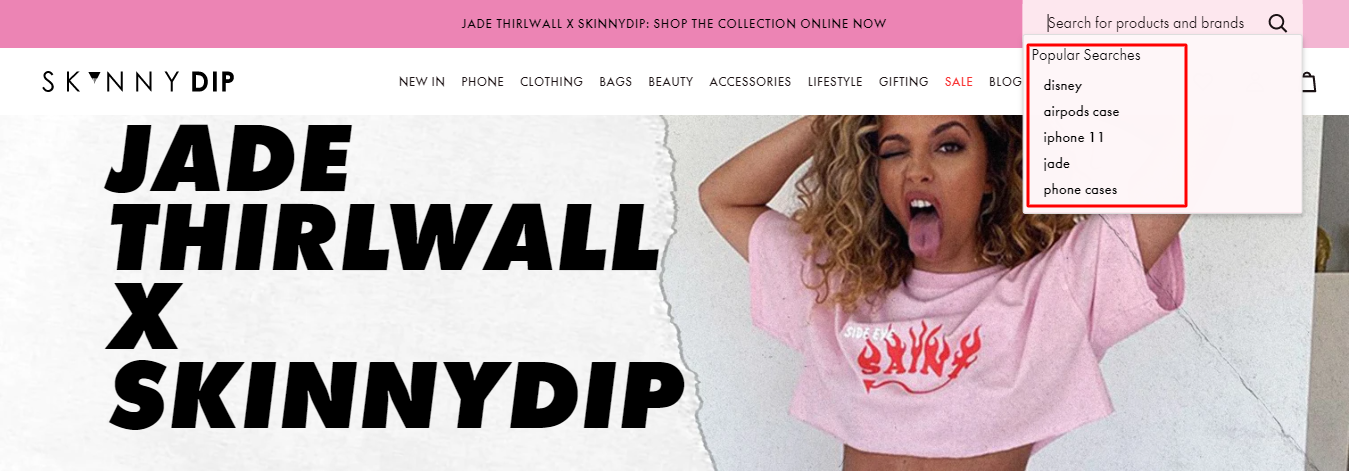
You can find out what to put in the “Popular Searches” by looking at the Top search terms of Boost’s Analytics
Boost Analytics can give store owners an insightful look into shoppers’ interaction with filters by showing Total filter clicks, Top filter value, and Top filter value combination.
Based on these data, you can change the order to make it quick and easy for them to combine filter options and navigate the right products.
Also, with the unpopular values, you may consider merging them together where possible, or completely delete them if unnecessary. This helps create a neat and clean interface for your site.
Watch our tutorial video to know more about how to use Analytics in the app:


